Retention Economics
Part of Retention dashboards
Showing uncertainty in projected customer value
Display customer-value forecasts with a clear horizon, assumptions, scenarios or justified intervals, and a separate observed-value figure.
Show projected customer value with its horizon, unit and uncertainty. Keep it visibly separate from observed value. A single forecast number can look precise when future order frequency, basket mix and costs are unsettled.
Label the figure before displaying it
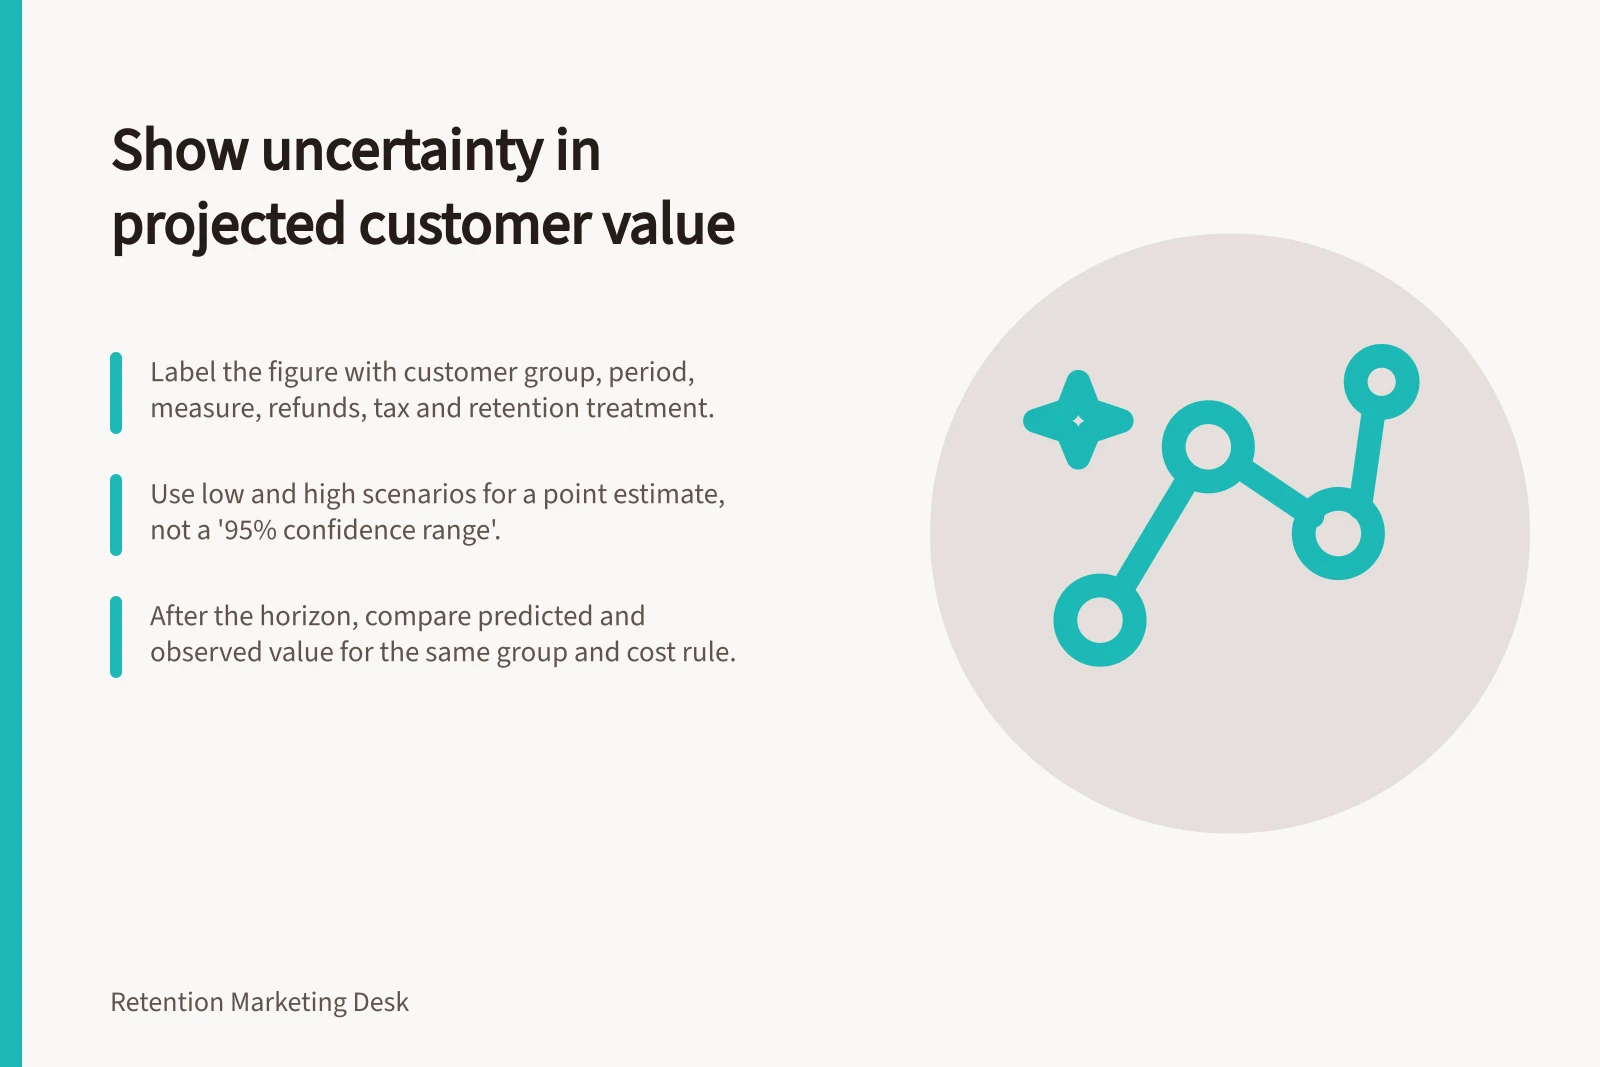
Define the starting customer group and future period. State whether the figure forecasts net sales, order contribution or another measure; whether it includes the first order; and how refunds, tax and retention spending are treated. Say whether the amount is per starting customer or for the whole group.
A possible label is “Projected repeat-order contribution per first-time buyer over the next two years, before retention program costs.” It illustrates the information a label should contain; it is not a forecast for a business. Show the customer count, observation cut-off, calculation version and date assumptions were last reviewed beside the figure.
Shopify's help centre lists Customers reports. Check the relevant report documentation and your account to confirm what is available. A sales measure is not automatically contribution or profit.
Label checklist for projected customer value
- Define the starting customer group
- State the future period
- Name the measure, such as net sales or order contribution
- Say whether the first order is included
- Explain how refunds, tax and retention spending are treated
- State whether the figure is per starting customer or for the whole group
- Keep projected value visibly separate from observed value
- Show the customer count, observation cut-off, calculation version and date assumptions were last reviewed
- Check the relevant report documentation and your account to confirm what is available
- Note that a sales measure is not automatically contribution or profit
Choose an honest display
| Evidence available | Suitable display | Label to avoid |
|---|---|---|
| A point estimate and defensible alternative assumptions | Central estimate with low and high scenarios | “95% confidence range” |
| A forecast distribution with a stated coverage level and credible checks | Point forecast with a prediction interval | “Guaranteed minimum and maximum” |
| Sparse history or unstable definitions | A provisional shorter-horizon figure, or “insufficient basis” | An exact lifetime-value claim |
Scenarios show the effect of changing assumptions. They do not acquire statistical probabilities because there are three of them. A prediction interval has its stated coverage interpretation under the model's assumptions; it is not a guarantee for an individual customer. State what the interval covers and what it leaves out.
Choosing a display for projected customer value
- A forecast distribution with a stated coverage level and credible checksUse a point forecast with a prediction interval. Avoid “guaranteed minimum and maximum”.
- Sparse history or unstable definitionsUse a provisional shorter-horizon figure, or state “insufficient basis”. Avoid an exact lifetime-value claim.
Show the assumptions that matter
List the drivers a reader needs to judge the forecast: expected later orders per starting customer, including those who never return; expected sales or contribution per order; refunds; and the cost basis. Indicate which historical groups informed the assumptions and whether they had enough follow-up. Keep the detailed value calculation separate from this dashboard display.
A sensitivity view can show how the result changes with repeat frequency, basket mix, discounts, refunds or variable costs. If a spending decision changes across plausible scenarios, show that dependence beside the headline. For scenario forecasts using assumed future inputs, a model's prediction interval may omit uncertainty in those inputs.
Assumptions to show beside projected customer value
- Expected later orders per starting customer, including those who never return
- Expected sales or contribution per order
- Refunds
- Cost basis
- Which historical groups informed the assumptions and whether they had enough follow-up
- Sensitivity to repeat frequency, basket mix, discounts, refunds or variable costs
- Whether a spending decision changes across plausible scenarios
- Whether the model’s prediction interval omits uncertainty in assumed future inputs
Check forecasts after their horizons pass
Preserve each forecast as issued. When its horizon has passed, compare predicted and observed value for the same customer group, unit and cost rule. For stated intervals, review how often later outcomes fell inside them and whether forecasts systematically overstated particular products or entry periods.
If a defensible interval cannot be estimated, use clearly labelled scenarios or a shorter horizon. Projected customer value describes possible future value under assumptions. It does not measure the extra value a retention campaign would cause.
Reviewing a projected customer value forecast after its horizon
- Preserve each forecast as issued
- When the horizon has passed, compare predicted and observed value for the same customer group, unit and cost rule
- For stated intervals, review how often later outcomes fell inside them
- Check whether forecasts systematically overstated particular products or entry periods
- If a defensible interval cannot be estimated, use clearly labelled scenarios or a shorter horizon
- Treat projected customer value as possible future value under assumptions, not as the extra value a retention campaign would cause