Retention Operations
Retention dashboards
Build a retention dashboard that separates eligible customers, repeat orders, revenue, subscriptions and uncertain forecasts.
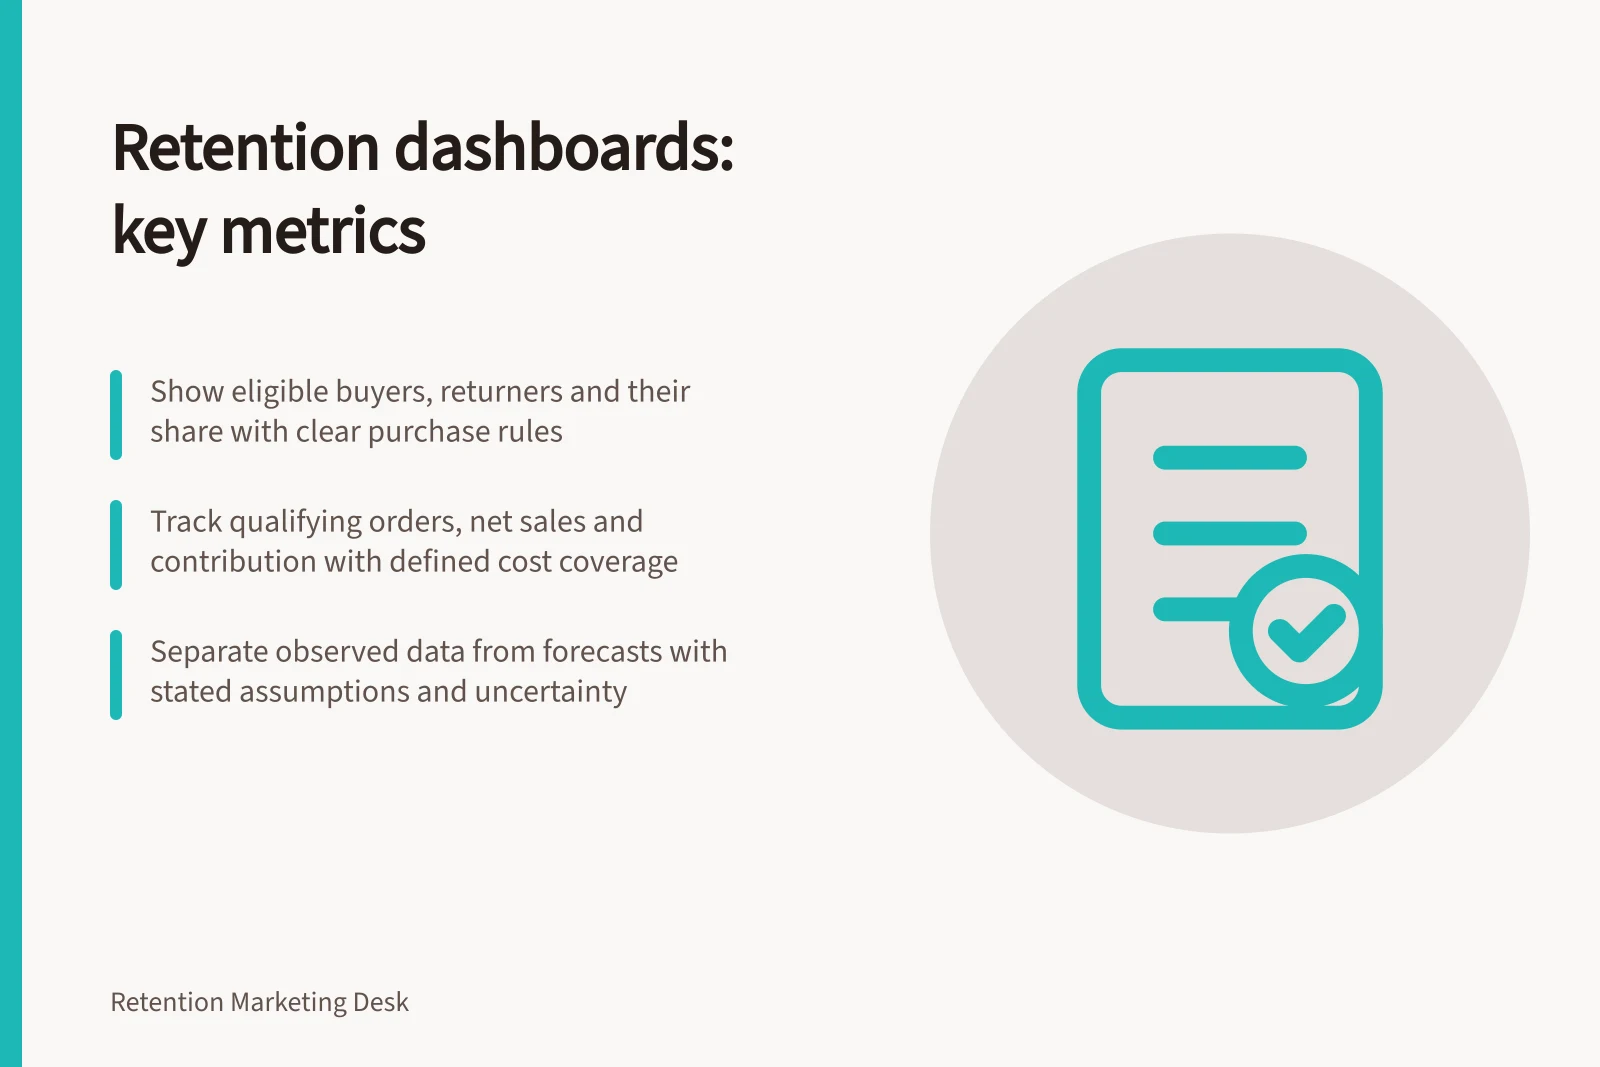
A retention dashboard should show how many customers had a fair opportunity to return, how many did, and what later orders were worth. Put customer counts beside sales, keep subscription activity separate, and label forecasts as forecasts. A single returning-customer percentage cannot answer all three questions.
Start with the decision
Before choosing charts, identify who will use the report and what they can change. A trading team may need to see whether fewer eligible buyers are returning. A product team may need to know which product group changed. A finance team may need observed contribution and the assumptions behind a future-value estimate.
| Question | Display | Essential qualification |
|---|---|---|
| How many customers returned? | Eligible prior buyers, qualifying returners and their share | State the purchase rule and full opportunity window. |
| What did they buy? | Qualifying later orders and net sales | State how refunds and subscriptions are treated. |
| What did those orders contribute? | Contribution where relevant costs are sufficiently covered | Name omitted costs; revenue is not profit. |
| What might happen next? | A dated forecast with assumptions and uncertainty | Keep projected value separate from observed sales. |
Use the overview to identify a change worth examining. Keep the population and calculation available in a detail view.
Return Rate Metrics: Eligible vs. Observed vs. Forecasted
- Eligible Prior Buyers (Opportunity Window)
- All customers with a qualifying purchase within the defined window
- Qualifying Returners (Observed)
- Customers who made a subsequent order within the opportunity window
- Forecasted Future Returns
- Projected return rate based on historical trends and assumptions
Separate metrics from the dimensions
Treat metric definitions as a shared layer beneath the charts: define each measure once, then let readers group it by dimensions such as product title, day or traffic source. Shopify classifies metrics as values such as counts, percentages, durations or money totals, while dimensions describe which item or group a result belongs to.
A visualisation in Shopify can display only two types of metric value at once. Keep unlike units in separate charts where necessary, and label axes and units so a count, percentage and money total are not mistaken for comparable measures. Use the selected grouping and filters as part of the chart’s visible context.
Give every measure a denominator and a clock
For a fixed-window return measure, start with a defined group after a qualifying purchase. Include only customers who have had the entire follow-up window by the reporting cut-off.
A recent buyer is pending, not a failed twelve-month returner. Specify whether a return means another store order, an order in the original category or a suitable substitute.
A period-based returning-customer report answers a different question. Shopify’s New vs returning customers report displays counts of first-time and returning customers for a given period. These period counts are not a mature cohort’s return rate, which measures returns among an earlier defined group of eligible customers.
Keep a definition panel with the customer identifier, covered channels, order states, tax basis, time zone, reporting cut-off and treatment of refunds, exchanges, replacements and subscriptions. If online and in-store identities cannot be joined reliably, show that limit beside the result. Mark a definition change as a break in the series.
Check whether a platform report’s time filter limits the activity being measured or only the customers included. Shopify customer-report data uses the new customers’ entire order history, not just orders placed in the selected timeframe. A customer first seen in November can therefore appear as a repeat customer in that report after a second purchase in December.
Keep different events apart
A new one-time purchase, a scheduled subscription order and a prepaid fulfilment are different events. Show one-time repeat purchasing and subscription billing separately.
For subscriptions, distinguish active contracts, successful recurring charges or resulting orders, and deliveries under prepaid orders. These counts need not match. Specify a line-item rule for mixed orders.
Product groups also need appropriate observation windows. A short window may suit an item bought frequently and reveal little about a durable item. Show each group’s window and mature customer count before comparing results. An all-store rate can move simply because the mix of eligible customers changed.
Check the report before interpreting it
Keep the underlying counts behind each percentage. Reconcile qualifying orders with sales and reversal records.
Inspect boundary cases such as a recent first buyer, a fully refunded order, a subscription renewal, a mixed basket and a customer with an older order in another channel. Shopify sales reports can include pending, unpaid and cancelled orders, so a custom completed-order measure needs an explicit order-state rule.
Place observed figures and projected figures in separate sections. A projection should state its starting group, horizon, unit, cost basis, assumptions and last update.
Low and high scenarios can show sensitivity; they are not statistical prediction intervals. If a model supplies an interval, label its meaning and review how earlier forecasts performed once their horizons have passed.
When a number moves, check data freshness, definition changes and the eligible count before looking for a behavioural explanation. Fewer returners alongside steady sales may mean larger orders from fewer people. More returners alongside lower contribution may reflect a different basket or cost mix. Neither pattern identifies a cause on its own.
End the review with the population, window, observed change, unresolved explanations and next check. Route a measurement problem to the data owner, a recurring service issue to operations and an uncertain campaign effect to a suitable comparison study.
Show data freshness beside the report name or last refresh time. Shopify customer reports might omit activity from the past 12 hours, while its New vs returning customer report is generally up to date within a few seconds; Shopify sales reports are generally up to date within about a minute. Refresh or reopen the report before treating a recent movement as final.
Make the sales basis explicit when comparing order value with customer return measures. Shopify defines net sales as gross sales minus discounts and sales reversals; total sales also includes additional fees, duties, shipping charges and taxes. Shopify’s gross profit measure subtracts product cost from net sales, so do not present it as contribution if other relevant costs are omitted.
Choose time groupings that suit the review question and keep the choice visible. Shopify’s New vs returning customers report can group results by hour, day, week, month, quarter or year, as well as hour of day, day of week or month of year. Changing the grouping changes how customers are displayed, not the underlying return definition.
If location is a useful review dimension, state its basis rather than implying a customer’s current residence. Shopify organises new customers by their most recent shipping location. Keep that qualification alongside any regional breakdown, particularly when readers compare geographic patterns over time.
In this guide
- Reporting retained customer count alongside revenueDefine eligible returners and report their count, orders and net sales together so changes in customer reach and spending stay visible.
- Separating repeat purchase from subscription renewalsKeep one-time repeat orders, successful renewals, active subscriptions and prepaid fulfilments distinct in retention reporting.
- Comparing retention across products with different usage cyclesCompare product retention with appropriate buying opportunities, mature customer counts and clearly labelled follow-up windows.
- Showing uncertainty in projected customer valueDisplay customer-value forecasts with a clear horizon, assumptions, scenarios or justified intervals, and a separate observed-value figure.