Churn Diagnosis
Customer experience problems that reduce retention
A customer who does not buy again may have lost interest, bought elsewhere or had a disappointing first order.
A customer who does not buy again may have lost interest, bought elsewhere or had a disappointing first order. Retention reporting shows the outcome, not the cause. Connect repeat-purchase patterns with delivery, product expectation and complaint records before sending another incentive.
Start with a comparable cohort
Group customers by first-purchase period and compare repeat purchasing after the same amount of time has elapsed. Shopify's customer reports include a customer cohort analysis report; check the report definitions before interpretation.
Separate product categories, channels and regions where those differences may explain the pattern. A low repeat rate for a product bought once every few years should not be judged against a consumable.
Shopify's New vs returning customers report groups customers by a selected unit such as week, month or quarter. Its customer reports also include average order count, average order totals and expected purchase value. These can add context to a repeat-rate change without treating every returning customer as equally valuable.
Check the data freshness as well as the date range. Shopify notes that customer reports might not display activity from the past 12 hours, whereas the New vs returning customer report is updated to within a few seconds. A recent movement may therefore appear differently across reports.
Read customer reports with their time boundaries
In Shopify customer reports, the data is based on the entire order history of the new customers in the report, not only orders placed during the selected timeframe. For example, if you access a report for November only, a new customer from that month can still display as a repeat customer even if they made their second purchase in December. Check the report definition before comparing periods.
Inspect the experience behind the number
Use a consistent issue tag or reason code when reviewing support records. Zendesk documentation shows that ticket tags can support reporting, but the categories are only useful if staff apply them consistently. Treat any pattern as a question to investigate, not proof of cause.
Key Customer Experience Metrics in Australia
Service quality shapes the reason to return
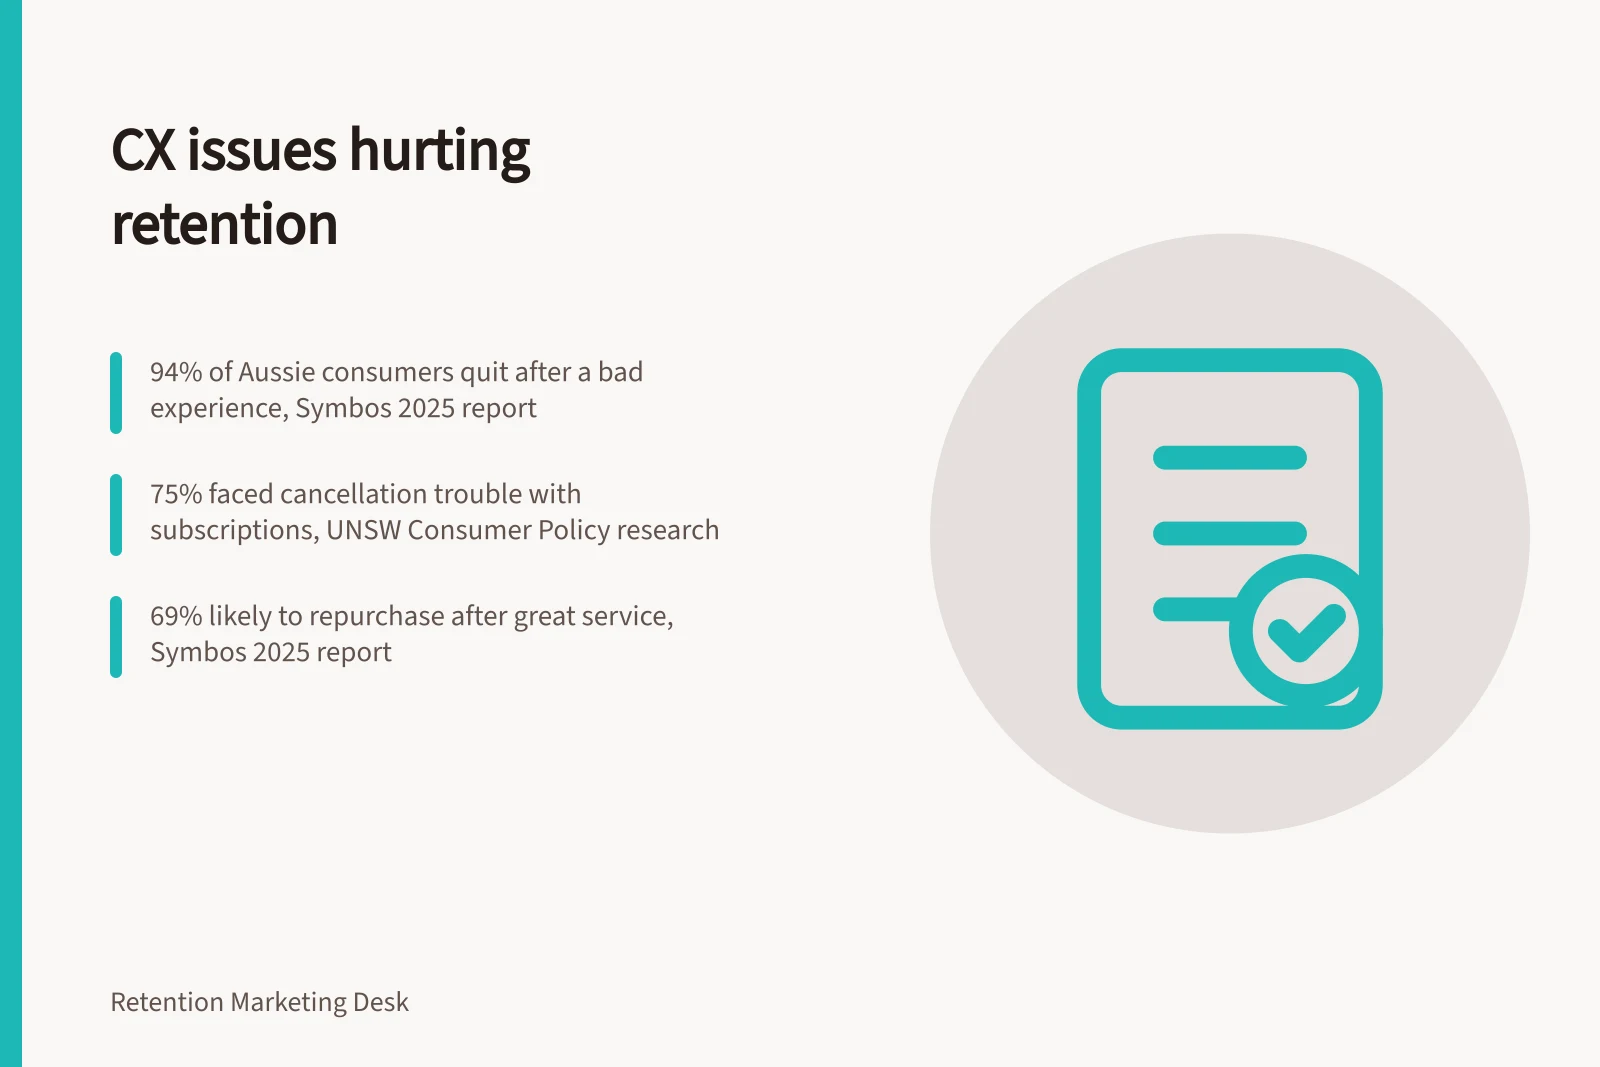
Symbos' 2025 State of Customer Experience report, produced with Swinburne University's CXI Research Group, found that 94 per cent of consumers had stopped purchasing from at least one company after a negative experience.
The same report found that after a great service interaction, 70 per cent of consumers felt satisfied and 69 per cent were likely to repurchase.
Australian consumers in the report ranked information accuracy as the leading driver of service excellence, at 91 per cent. Access to knowledgeable representatives was cited by 84 per cent, and consistency across channels by 79 per cent.
Drivers of Service Excellence in Australian CX
- Information accuracy91%
- Access to knowledgeable representatives84%
- Consistency across channels79%
Match support to the complexity of the request
The Symbos report found that 46 per cent of consumers preferred digital self-service, such as a website or FAQs, for simple enquiries. For more complex issues, 77 per cent preferred speaking with a person over the phone.
The report also found that 67 per cent cited 24/7 availability as the greatest benefit of AI-powered chatbots, while consumers still favoured human help for complex enquiries.
A useful service design can make self-service available for straightforward questions while providing a clear route to a person when the issue needs more explanation or judgement.
Customer Support Preferences by Request Complexity
- Simple enquiries – preferred support method
- Digital self-service (e.g. FAQs, website)
- Complex issues – preferred support method
- Phone call with a person
- Preferred benefit of AI chatbots
- 24/7 availability (67%)
Support the people delivering the experience
A Humanforce survey reported that 79 per cent of Australian casual workers said their happiness at work directly affected the customer experience they could deliver. It also found that 82 per cent had direct contact with customers or the public in their job, making frontline staff part of the experience customers remember.
In that survey, 62 per cent of casual workers said their employer empowered them to interact with customers, while 69 per cent said their employer provided specific training and support for managing customer relationships.
Make subscription exit clear
A difficult cancellation can itself create a negative customer experience, even when a customer has decided not to continue. UNSW's account of Consumer Policy Research Centre research reported that 75 per cent of Australian consumers had experienced problems trying to cancel a subscription.
The examples described include making cancellation options hard to find, requiring a phone call during business hours, or putting several steps and offers between a customer and cancellation. Some businesses, the report says, make starting a subscription a single click while making it much harder to end.
Best Practices for Reducing Subscription Cancellation Friction
- Ensure cancellation options are easy to findPlace clear links in account settings and email receipts
- Offer cancellation via web portal without phone callsAvoid requiring business-hours-only contact
- Do not place multiple steps or upsells before cancellationPrevent bait-and-switch tactics that delay exit
- Match ease of sign-up with ease of cancellationIf joining is one click, exiting should be equally simple
Keep operational causes in view
A recurring delivery or product-expectation problem can sit behind a repeat-purchase change. Diagnosing and fixing it belongs with the relevant operational or product review.
In this guide
- Finding recurring delivery issues in lost-customer cohortsDelivery trouble can damage a first purchase, but a low repeat rate alone does not show that delivery caused it.
- Checking whether product expectations match the purchase pageChecking whether product expectations match the purchase page: practical criteria and a clear evaluation process for marketing teams.
- Linking unresolved complaints to later inactivityA complaint that is marked “solved” in a ticket system may still feel unresolved to the customer.
- Prioritising operational fixes before more retention messagesWhen customers repeatedly report the same problem, an extra discount email can create another order with the same failure.