Cohort Analysis
Part of Retention cohort analysis
Reading cohort curves without confusing seasonality with churn
Check elapsed time, calendar season, curve calculation and cohort maturity before calling a drop in repeat purchasing churn.
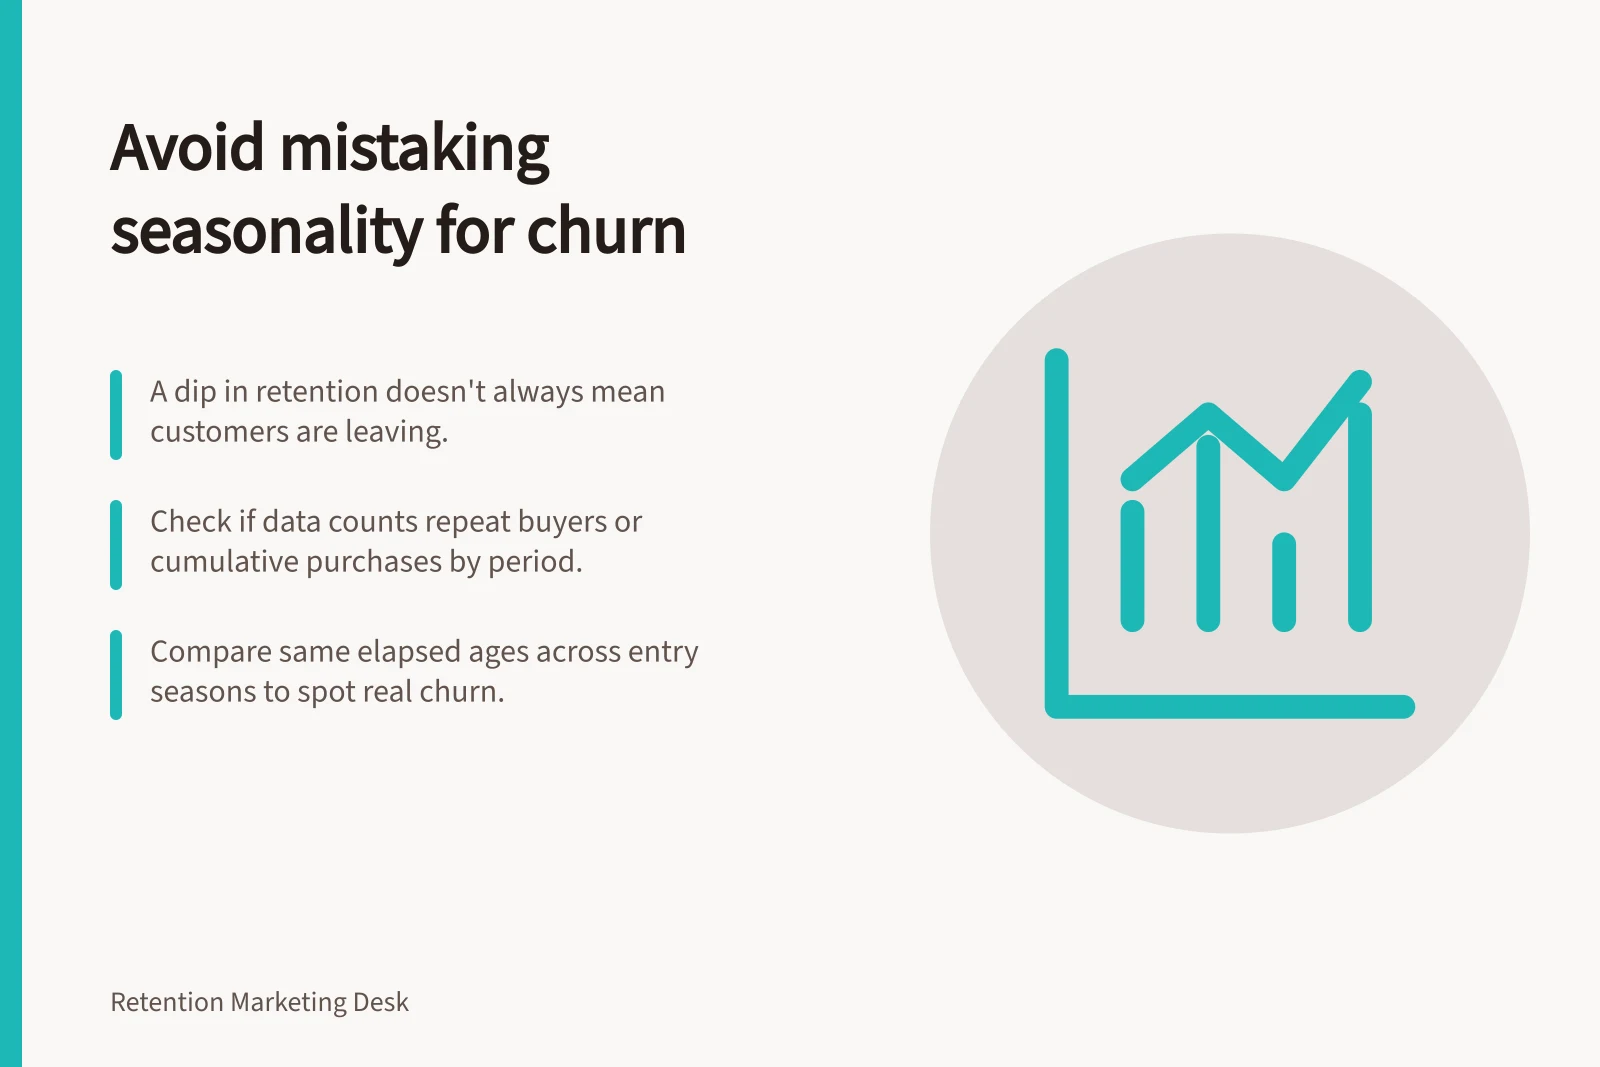
A dip in a retention curve is not automatically churn. A cohort chart combines two clocks: elapsed time since a customer's first purchase and the calendar dates on which later purchases could occur. Read both before concluding that customers are leaving.
Identify what each point counts
Check whether the curve counts customers who purchased in each interval or customers who have purchased at least once by that point. The first can rise after a quiet interval because people may return later. The second is cumulative and should not be read as sales made in the latest interval.
Check period zero as well. If calculating cumulative repeat purchasing from order records, exclude the entry purchase itself.
Do not compare a recent cohort's missing future periods with an older cohort's observed periods. Show the number of eligible customers too: a small cohort can produce a jagged percentage without a broad change in behaviour.
Key Metrics to Verify Before Assessing Churn
- Curve Type
- Cumulative repeat purchases (excludes entry purchase)
- Reporting Consistency Check
- No recent data schema changes
Put elapsed age beside calendar date
For each cell, note its cohort entry period, elapsed month and actual calendar month. Imagine a hypothetical seasonal gift category: buyers enter in December, and month six in a calendar-month cohort grid falls in June.
A low June repeat figure may reflect the absence of another gift occasion; it does not establish that those buyers rejected the retailer. A rise near the next December may reflect renewed opportunity rather than a change in the customer experience.
- Same elapsed age, different entry periods:does the apparent drop recur for several cohorts at the same age?
- Same calendar period, different cohort ages:do several groups dip when their follow-up lands in the same quiet season?
- Comparable entry season across years:do customers who entered in like seasons show a similar elapsed pattern, allowing for changed products, prices and data coverage?
No single comparison removes every difference. Product mix, promotions, stock availability and observation time still need checking. A comparison control cannot establish why a curve changed.
Cohort Retention: Aligning Elapsed Age with Calendar Season
- Cohort Entry Period
- December (Holiday Gift Season)
- Elapsed Month 6
- June
- Calendar Month
- June
- Next Likely Purchase Window
- December (Next Holiday Season)
Distinguish timing from a persistent shortfall
A seasonal explanation becomes more plausible if repeat activity falls in the same calendar season across cohorts and later recovers when a relevant buying occasion returns. A retention concern becomes more plausible if comparable cohorts entering in like seasons remain weaker at several fully observed elapsed points, including after the next plausible buying opportunity. These are patterns to investigate, not diagnoses of individual customers.
Look at the cumulative share making a first repeat purchase as well as the per-period purchasing curve. If the per-period line dips but the cumulative share later catches up, timing may explain some of the early difference. If the cumulative gap persists, investigate it further. Check completed orders, returns and customer identity before assuming the curve reflects behaviour rather than a reporting change.
Finish with a bounded statement that names the cohorts and product group, the elapsed window, the calendar periods, the measure used and what remains unexplained. If the next seasonal buying opportunity has not occurred, say so and review the cohort after it has passed.
Seasonal Dip vs Persistent Churn: Cohort Patterns Across Years
- Cohort Entry Season
- December
- Repeat Purchases in June (Same Elapsed Age)
- Low across multiple cohorts
- Repeat Purchases in December (Post-Season Recovery)
- High and consistent
- Cumulative Repeat Rate After 12 Months
- Stable or rising post-season
How to Avoid Misinterpreting Seasonality as Churn
- Confirm curve type (cumulative vs per-period)Exclude initial purchase from cumulative count
- Map elapsed age to calendar dateCheck if dip aligns with quiet season
- Compare across cohorts entering same seasonLook for recurring patterns at same elapsed age
- Evaluate recovery after next buying occasionA rebound suggests timing, not churn
- Report with bounded contextSpecify cohort, window, product group and unexplained factors