Cohort Analysis
Part of Retention cohort analysis
Comparing retention across acquisition sources
Assign a consistent acquisition source, compare mature first-purchase groups and account for product mix before interpreting repeat-purchase differences.
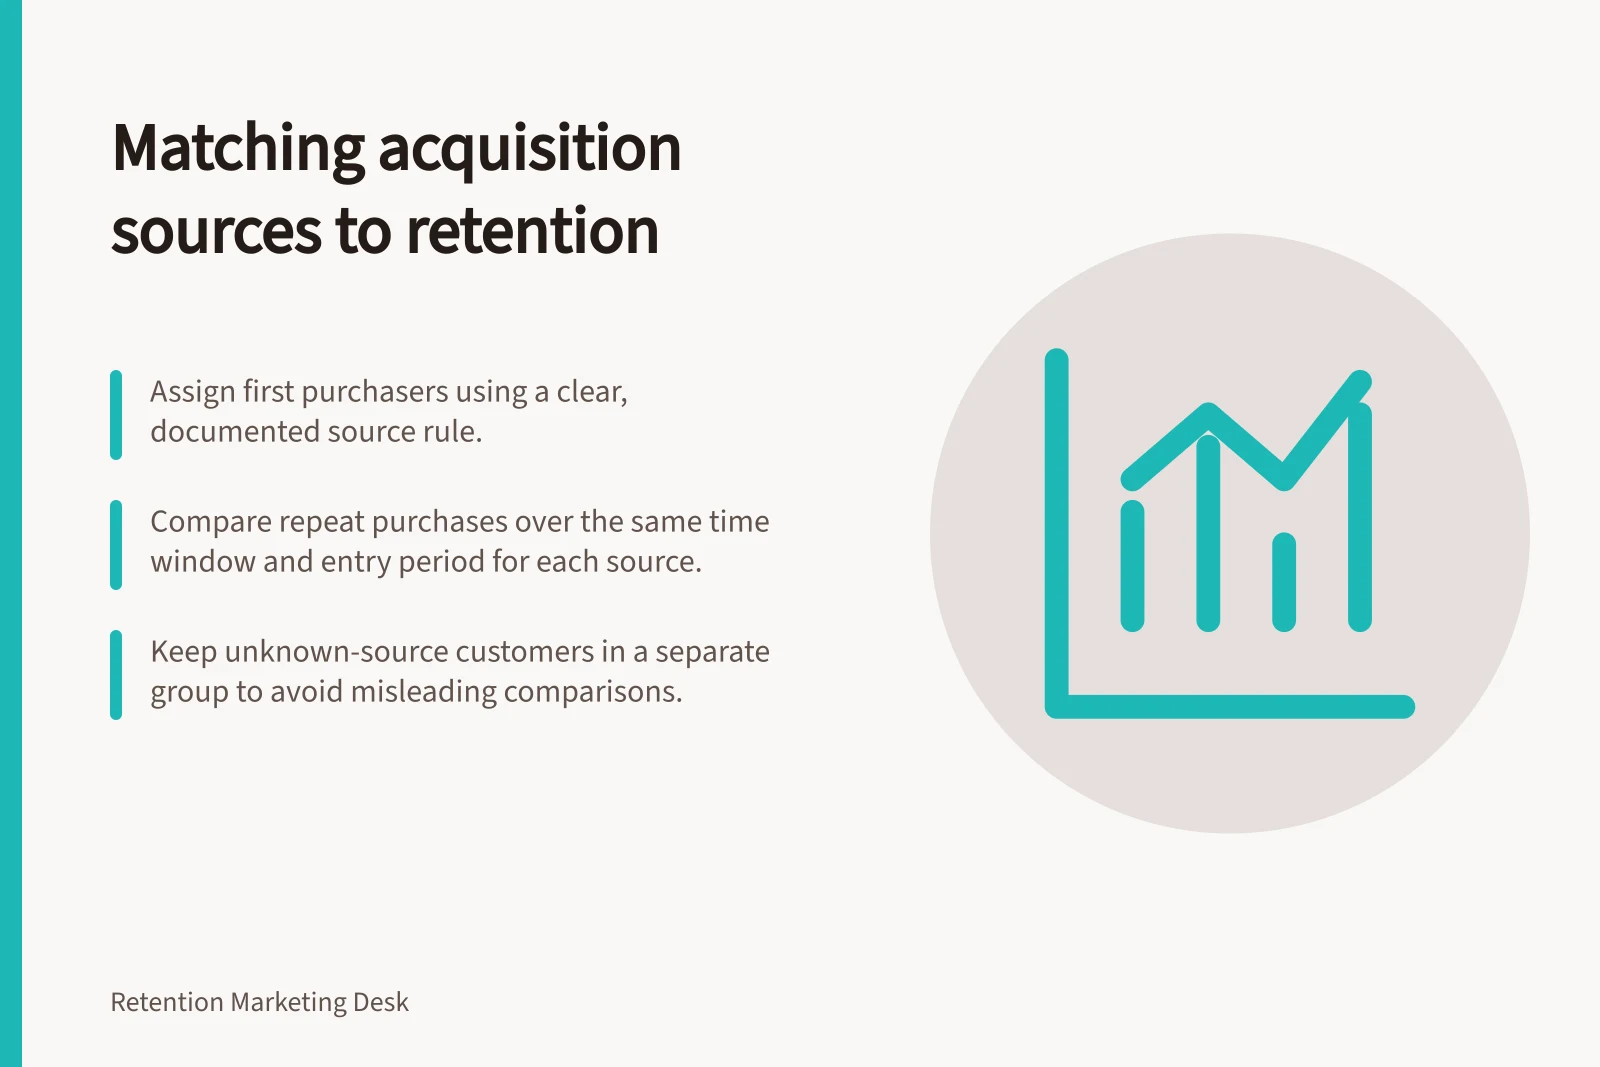
Assign each eligible first purchaser a source under one documented rule. Measure the same qualifying repeat purchase over the same elapsed window for each source group.
Keep customers whose source is unknown in a separate group. A higher observed repeat rate can guide investigation; it does not prove that the channel caused better retention.
Choose the source that answers the question
A specific rule is needed for “Where did this customer come from?” The first website visit, the session containing the first order and a retailer’s first-order marketing channel can differ.
Google Analytics presents user acquisition and traffic acquisition as separate reports. Their values should not be compared as though they assigned the same source to the same customer population.
If the decision concerns which route brings in customers who later buy again, use a source attached to the qualifying entry event or a clearly defined earlier acquisition touchpoint. Keep that choice consistent. Preserve an unknown group for missing or conflicting source data rather than distributing those customers across named channels.
For stores with offline sales, check whether a source is available for those first orders and whether later purchases can be joined back to the customer. A website-only report may describe website users or transactions rather than all store customers.
Best Practices for Comparing Retention Across Acquisition Sources
- Define a consistent source rule for first purchasersUse the session containing the first order or a clearly defined acquisition touchpoint.
- Keep unknown-source customers in a separate groupDo not distribute missing or conflicting data across named channels.
- Ensure offline sales are accounted for if applicableVerify source availability and customer linkage for in-store first orders.
- Use the same time zone and follow-up lengthApply consistent criteria across all source groups for fair comparison.
Hold the purchase comparison steady
Build a table with one row for each entry-period and source combination. Use the same qualifying first purchase, return rule, time zone and follow-up length throughout. For a six-month second-purchase comparison, include only people who have completed six months of observation since their own entry purchase. Report the eligible count, returning count and percentage for every source; a percentage from a small group needs cautious interpretation.
Avoid comparing one source’s newest customers with another source’s older customers. Where campaign volume or product mix has shifted, compare sources within the same entry periods and, where useful, within comparable first-purchase product groups.
A channel that brings many one-off gift buyers may show a different repeat pattern from one that brings refill buyers. That is a difference in customer mix, not proof of a channel’s intrinsic quality.
Check / Why it matters
- Entry source and assignment rule
- Prevents first-visit and purchase-session sources being silently combined.
- Mature customers and equal follow-up
- Prevents recent buyers being counted as non-returners too early.
- First-order product and offer mix
- Shows whether unlike buying opportunities contribute to the contrast.
- Unknown and unlinked orders
- Makes the limits of source coverage visible.
Retention Rates by Acquisition Source: Key Considerations
- Entry source and assignment rule
- Prevents first-visit and purchase-session sources being silently combined.
- Mature customers and equal follow-up
- Prevents recent buyers being counted as non-returners too early.
- First-order product and offer mix
- Shows whether unlike buying opportunities contribute to the contrast.
- Unknown and unlinked orders
- Makes the limits of source coverage visible.
Retention Analysis Metrics by Source Group
- Eligible count
- Number of customers with a qualifying first purchase in each source group
- Returning count
- Number of customers who made a repeat purchase within the follow-up window
- Repeat rate (%)
- Returning count divided by eligible count, expressed as a percentage
Use the difference to guide investigation
If two sources show different six-month repeat rates, check whether customers entered during comparable months and bought comparable products. Then inspect first-order experience, discounts and subsequent order records. The result may justify a closer review of source quality or the offer used to attract buyers, but it does not identify a cause on its own.
Retention is only one part of an acquisition decision. A source may bring fewer repeat purchasers but more first orders, or have a different acquisition cost.
If reliable cost and contribution data are unavailable, report the retention comparison alone rather than declaring one source commercially superior. Record the source definition and exclusions so the next review uses the same population.